Physical Address
304 North Cardinal St.
Dorchester Center, MA 02124
Physical Address
304 North Cardinal St.
Dorchester Center, MA 02124

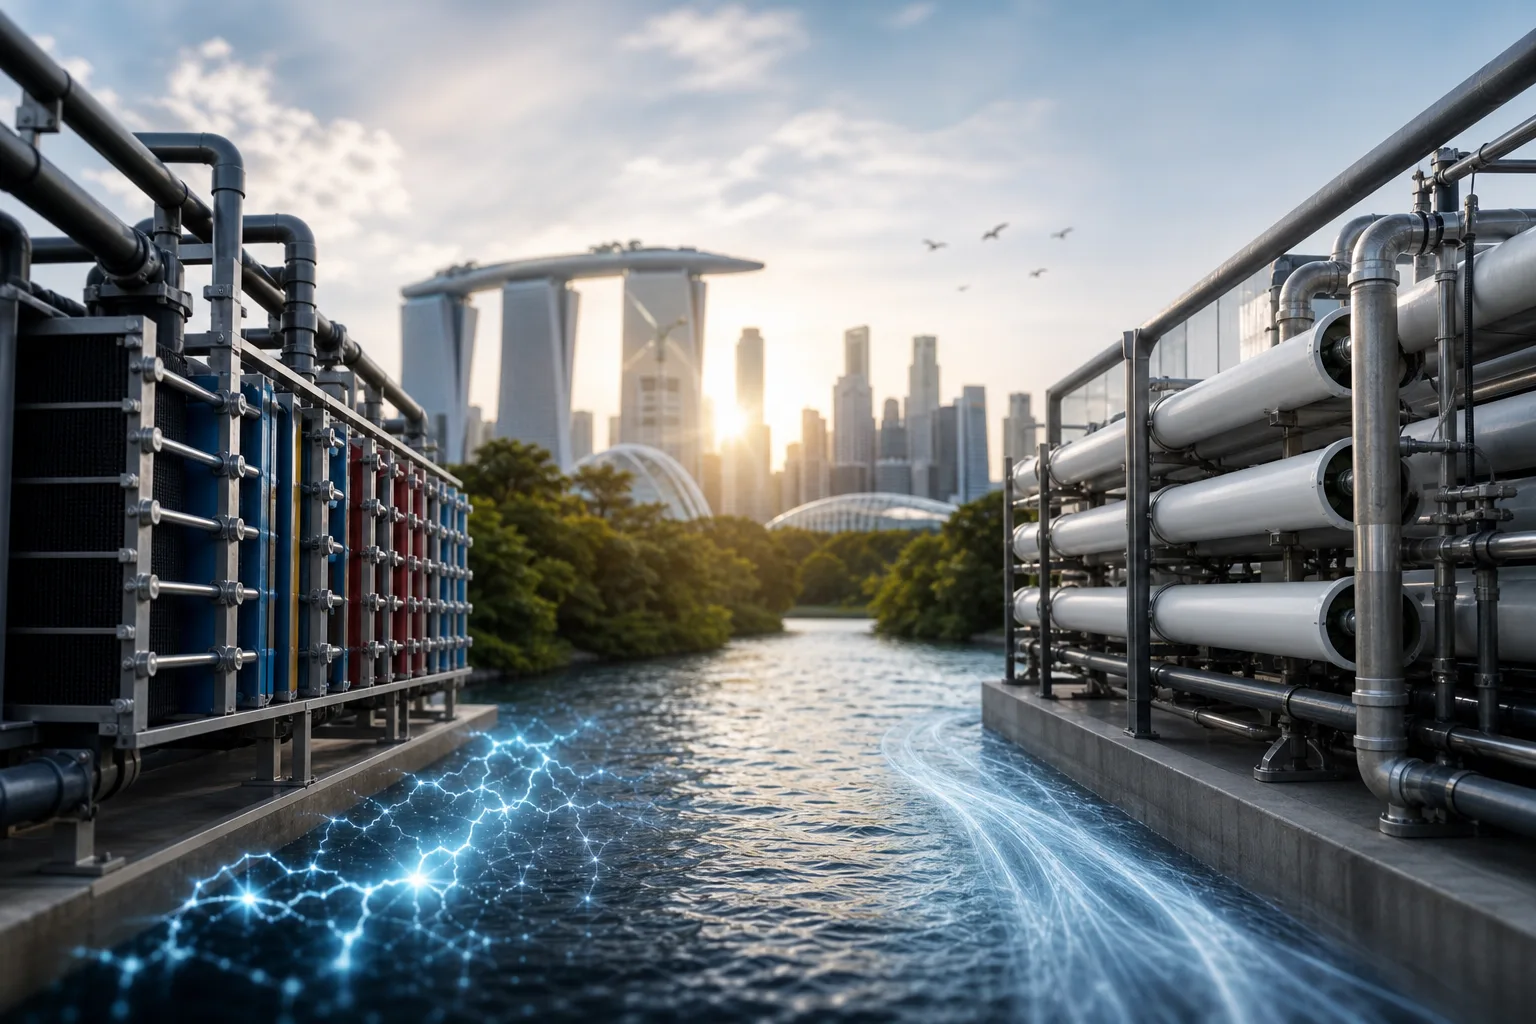
This article breaks down the key differences between reverse electrodialysis and pressure-retarded osmosis, focusing on feed requirements, plant integration, and energy performance to help determine the best fit for your desalination site.
At your Singapore desalination site, the brine line is ready, a lower-salinity wastewater stream is nearby, and the decarbonisation plan is under review. Yet the proposed system still stalls when engineering asks where it connects, what each feed requires, and what happens when water quality changes. That is the practical question behind reverse electrodialysis vs pressure-retarded osmosis. One option moves water through membranes. The other moves ions.
Most salinity-gradient projects don’t have a technology-awareness problem. They have a fit-and-integration problem. Environmental Science & Technology describes both pressure-retarded osmosis and reverse electrodialysis as membrane technologies that convert salinity-gradient chemical energy into useful work. A definition of blue energy isn’t enough.
The choice depends on feed compatibility, plant connections, energy conversion, maturity, and delivery risk. MediSun Energy’s integrated brine-management approach may also support resource recovery, decarbonizing desalination, and CO₂ mineralization. Every option still depends on measured streams and workable site interfaces.
Suitable brine and wastewater don’t prove that either membrane architecture will integrate. You need a repeatable screen based on measured streams, available interfaces, operating constraints, and the output your project can use.
Apply six tests before comparing vendor claims. The salinity gradient matters too: PRO gains osmotic pressure as concentration differences rise, while RED’s Nernst potential increases logarithmically, according to Environmental Science & Technology (2014).

Both PRO and RED involve a trade-off between efficiency and power density, according to Environmental Science & Technology (2014).
Document conductivity, salinity, contaminants, seasonal flow changes, pressure availability, pretreatment, and discharge obligations before requesting a design. More permeable membranes may raise power density but can increase unwanted entropy production and reduce efficiency, according to Environmental Science & Technology (2014).
The real difference appears at the plant boundary. Start with the streams and interfaces already available, then test each technology against fouling risk, pressure, controls, maintenance access, and usable energy output.
Practical rule: Start with the streams and interfaces already available, then test the technology claim against measured site conditions.
Choose the architecture that addresses the site’s main duty. Resource recovery and decarbonizing desalination may point toward RED integration, while a defined osmotic-power duty may justify PRO. RED’s ion-driven architecture is the next point of comparison.
You can use desalination brine and wastewater as the two streams, but RED won’t fit automatically. You need to check conductivity, flow continuity, pretreatment, and membrane access before the stack can support useful integration.
You should treat RED as more than a power device. Its lower power density can still make sense when your main duty is brine management, resource recovery, and decarbonizing desalination.

When you use alternating cation- and anion-exchange membranes, ions move in opposite directions through salinity-gradient compartments. That ion flux creates an electrical potential, but the available comparative study reported only 18–38% efficiency and 0.77–1.2 W/m² power density under its 2014 membrane assumptions. Those figures aren’t a current guarantee.
You can use desalination brine as the concentrated stream and lower-salinity wastewater as its counterpart. Low membrane conductivity restricts ion flux and output, according to Environmental Science & Technology in 2014. If you work with high concentrations, you may also weaken Donnan exclusion, reducing permselectivity and energy-conversion efficiency.
| situation | better move |
|---|---|
| Desalination brine and lower-salinity wastewater are available | Screen RED when conductivity, flow continuity, and pretreatment can support an ion-exchange membrane stack |
| Ion-exchange membrane conductivity is limiting output | Treat power density as a design constraint and test stack configuration before sizing the project |
| Very high solution concentrations are expected | Check permselectivity and energy-conversion efficiency because Donnan exclusion may be suppressed |
| The project has a wider brine-management objective | Assess RED as part of an integrated MediSun Energy resource-recovery and CO₂-mineralization pathway |
If you’re planning a Singapore project, RED fits best when your measured streams support wider circular solutions. MediSun Energy can assess that route across brine management and resource recovery, but you still need site validation data covering conductivity, concentration, flow, fouling, temperature, and pretreatment.
A strong salinity difference alone won’t make a PRO design work. The low-salinity feed must remain clean and continuous, while the high-salinity draw must support pressure, flow control, and turbine integration.
PRO therefore suits a defined osmotic-power duty, not every brine-management project. Reported conversion metrics may be stronger, but feed reliability and membrane losses determine whether the plant interface works.
Water crosses a salt-rejecting membrane from the low-salinity feed into a pressurised high-salinity draw. The resulting draw flow can pass through a turbine. Environmental Science & Technology described PRO as water permeation across salt-rejecting membranes, unlike RED, which uses ion flux across charged membranes.
The feed needs low contamination, stable flow, and pretreatment matched to the membrane. Reverse salt flux and concentration polarisation can reduce the usable osmotic gradient, so higher salinity doesn’t automatically mean better economics.
| situation | better move |
|---|---|
| A clean, continuous low-salinity feed and high-salinity draw are available | Screen PRO for a defined osmotic-power duty and hydraulic integration |
| The draw side can supply controlled pressure below the osmotic pressure difference | Evaluate turbine coupling, pressure recovery, and net power after pumping demand |
| Reverse salt flux or concentration polarisation is significant | Prioritise pretreatment, membrane testing, and module-design validation |
| The low-salinity feed is intermittent or contaminated | Treat feed reliability as a project risk before selecting PRO |
Under specified membrane assumptions, the cited comparison reports PRO efficiency of 54–56% and power density of 2.4–38 W/m². Those are study results, not universal modern plant performance. Environmental Science & Technology attributed PRO’s stronger efficiency to better use of the salinity difference and lower detrimental salt leakage.
PRO may win on reported conversion metrics. RED may still be the more natural fit for variable brine-management and resource-recovery duties.
Published performance can make pressure-retarded osmosis look like the obvious choice. The more useful question is whether a Singapore site can supply both feeds continuously and connect the process without weakening plant reliability.
The stronger benchmark isn’t always the stronger project. Weigh conversion results against pretreatment, hydraulic equipment, electrical interfaces, and the value of managing brine streams.

| criterion | Reverse electrodialysis vs pressure-retarded osmosis | edge |
|---|---|---|
| Working principle | Reverse electrodialysis uses ion flux through charged membranes; pressure-retarded osmosis uses water permeation through salt-rejecting membranes into a pressurised draw stream | Depends on the available electrical or hydraulic interface |
| Reported energy performance | Reverse electrodialysis: 18–38% efficiency and 0.77–1.2 W/m²; pressure-retarded osmosis: 54–56% efficiency and 2.4–38 W/m² in the cited study | Pressure-retarded osmosis on the cited benchmark |
| Feed requirement | Reverse electrodialysis can use concentration differences such as brine and wastewater when conductivity and pretreatment are suitable; pressure-retarded osmosis needs compatible low- and high-salinity feeds | Reverse electrodialysis for broader brine-management screening |
| Plant integration | Reverse electrodialysis primarily produces electrical output through a membrane stack; pressure-retarded osmosis requires pressurised draw hydraulics and turbine integration | Site-dependent |
| Project fit | Reverse electrodialysis aligns with circular brine and resource-recovery objectives; pressure-retarded osmosis aligns with a defined osmotic-power duty | Reverse electrodialysis for integrated brine management; pressure-retarded osmosis for stable hydraulic power duty |
A comparative study reported PRO at 54–56% efficiency and 2.4–38 W/m², compared with RED at 18–38% and 0.77–1.2 W/m², according to Environmental Science & Technology in 2014. These are study results, not guaranteed outcomes for a plant.
The clearest decision edge comes from checking feed continuity first. PRO may suit a site where stable low- and high-salinity streams already connect to pressurised hydraulics and turbine recovery. RED may fit better when the priority is electrical generation alongside variable brine management and resource recovery.
MediSun Energy can assess RED within a circular brine system, although the process still depends on conductivity, pretreatment, and reliable flow. Project maturity therefore rests less on the technology label than on whether existing interfaces support the chosen duty.
The operating objective should decide the architecture, not the promise of blue energy alone. Choose RED for brine management, resource recovery, or changing waste streams. Choose PRO when compatible streams are already available and hydraulic power is the goal.
The evidence also needs to be read in context. A 2014 study in Environmental Science & Technology found PRO more suitable across a range of salinity gradients, while RED cannot benefit from larger gradients to the same extent. The study also says major ion-exchange membrane advances are needed for RED to compete with PRO on energy performance.

When desalination brine management and resource recovery are the priorities, start with RED. Conductivity, pretreatment, variable flow, discharge requirements, and downstream recovery can be assessed together rather than treating power generation as the only duty.
For a factory with variable waste streams and a decarbonisation target, choose RED for an integrated assessment. MediSun Energy can assess RED with brine management and CO₂ mineralization, although measured stream quality and continuity still determine whether the design works.
| situation | better move |
|---|---|
| Desalination operator prioritising brine management and resource recovery | Start with a RED integration assessment and test the complete brine-management pathway |
| Industrial manufacturer with variable waste streams and a decarbonisation target | Evaluate RED alongside resource recovery and CO₂ mineralization, using measured stream data |
| Project has stable, compatible low- and high-salinity streams and a hydraulic-power objective | Screen PRO, including pretreatment, pressure, turbine, and net-energy requirements |
| Agency planning low-carbon water infrastructure | Compare both pathways against long-term feed reliability, integration risk, and circular-economy outcomes |
For Singapore water infrastructure, treat RED and PRO as separate pathways, not interchangeable generators. Require:
Begin with site evidence, not a preferred membrane. A Singapore plant may have several brine, wastewater, cooling, and industrial streams, but their timing and interfaces determine what can actually be integrated.
A clear stream map is a safer starting point than a headline power figure. It shows whether the project suits RED, PRO, resource recovery, or CO₂ mineralization.
Start with one page covering every relevant source, destination, flow path, electrical connection, hydraulic connection, and discharge point.
Measure salinity and conductivity during normal and peak operation. Add contaminants, temperature, pressure, pretreatment, and seasonal or production-related variation.
Use the same evidence for RED and PRO. Score feed reliability, pretreatment, integration, energy performance, maturity, and project fit without treating a technology preference as a result.
Set one intended output: electricity, hydraulic power, brine valorisation, resource recovery, or CO₂ mineralization. Then define what the pilot will receive, change, measure, and return.
Measurement comes first. Integration design decides the technology.
If you want a faster way to screen your site, MediSun Energy assesses stream data, RED integration, and circular-brine opportunities for desalination operators, industrial manufacturers, and infrastructure partners through its technical articles and project insights.