Physical Address
304 North Cardinal St.
Dorchester Center, MA 02124
Physical Address
304 North Cardinal St.
Dorchester Center, MA 02124

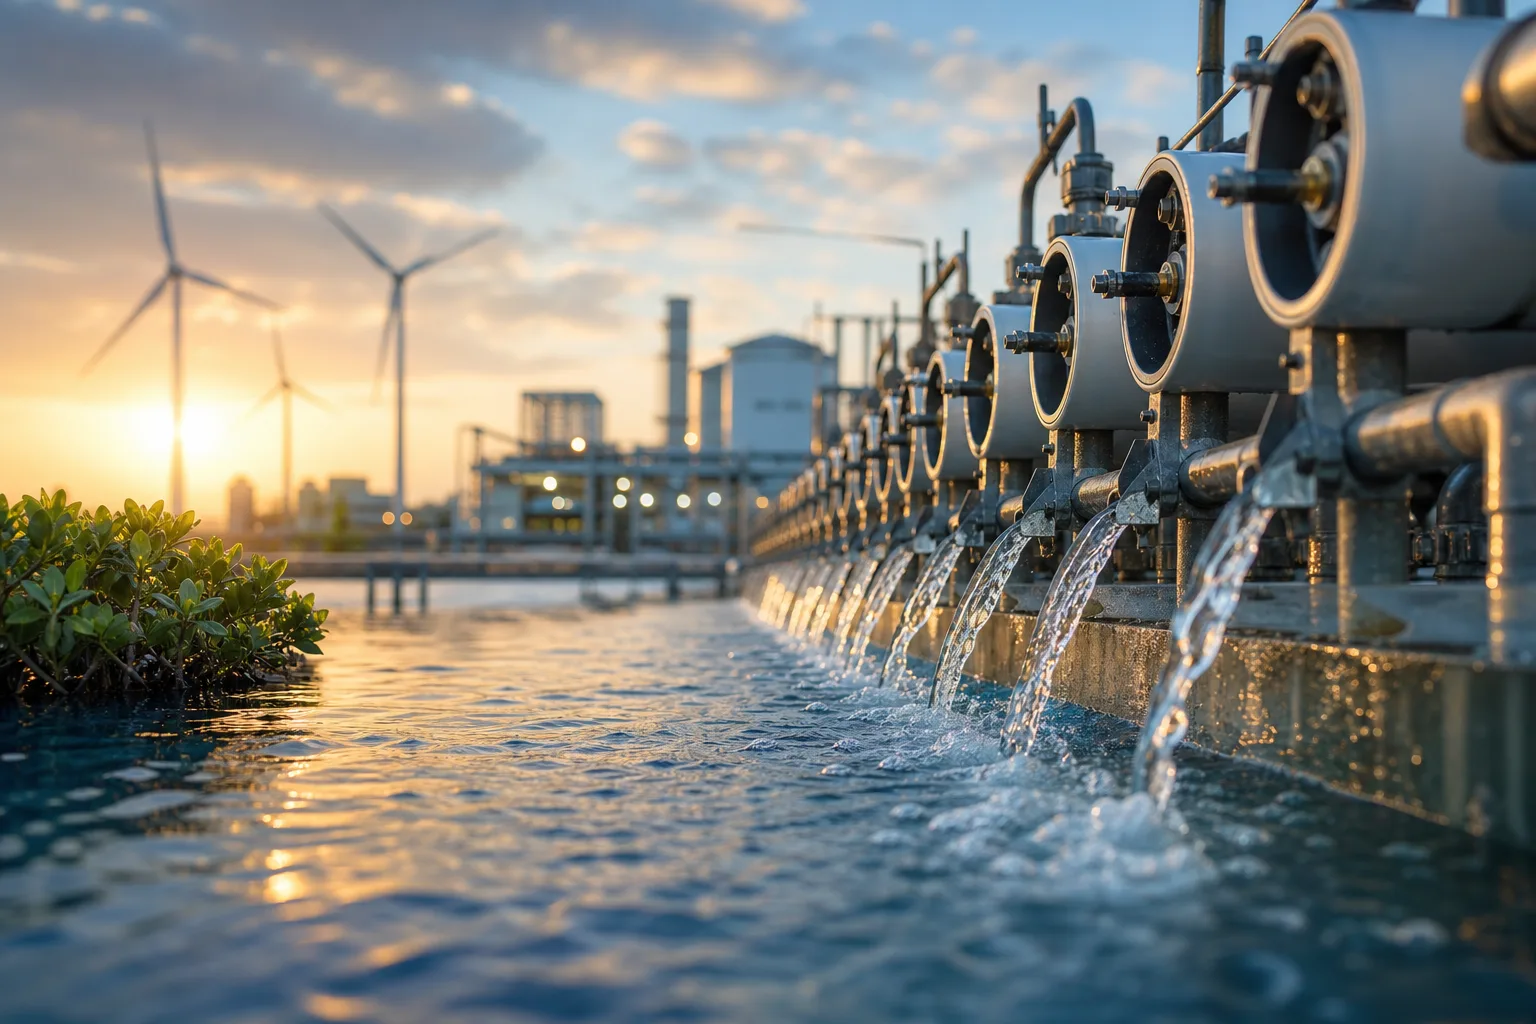
Discover the critical factors that determine successful energy recovery in Pressure-Retarded Osmosis and RED, including system integration, feed compatibility, and real-world performance beyond theoretical potential.
Your shift ends with a familiar decision: send your desalination brine to discharge, push it through another treatment stage, or test whether its salinity gradient can create value. At an industrial site, you may face the same choice with a concentrated waste stream, uncertain chemistry, and limited space for new equipment. Evaluating Energy Recovery Opportunities in Pressure-Retarded Osmosis and RED starts with fitting the recovery unit to Singapore’s water infrastructure, operating constraints, and downstream controls.
Most energy recovery projects don’t have a technology problem. They have a fit problem. Your feed quality, integration point, and performance claim must match operating reality, not a promising laboratory result.
The comparison becomes useful when you assess what each pathway needs before choosing one. MediSun Energy brings Reverse Electrodialysis and CO₂ mineralization into that wider brine-management decision, although your site still determines whether either route is practical.
PRO and RED can support energy recovery, discharge management, or resource recovery, but the project signals matter. They separate a credible Singapore opportunity from an attractive but unsuitable result.
A salinity gradient can look valuable before you count the equipment needed to use it. You still pay for pumping, pretreatment, membrane area, pressure exchange, cleaning, controls, and downtime. Gross osmotic potential is not the electricity your plant can use.
That distinction matters when you compare desalination brine with an industrial waste stream. You need stream compatibility and net output, not a headline value that disappears after integration. The recovery system should improve the whole process, including brine management and resource recovery.

You may see a strong PRO result at the membrane and still export little usable electricity. Feed pressure, flow stability, suspended solids, scaling ions, and temperature all affect the duty cycle. A fouling-control programme can also add chemical use, cleaning time, and disposal costs.
Weak screen: “This brine contains enough osmotic energy to justify a PRO unit.”
Strong screen: “After intake pumping, pretreatment, pressure exchange, cleaning, and controls, the Tuas brine stream must deliver positive net electricity during its normal operating cycle.”
Research published in Membranes on 19 March 2023 found that accounting for under-pressurisation and entropy generation reduced atmospheric batch PRO efficiency by approximately 40%. Treat an unadjusted efficiency figure as an upper boundary, not a project output.
Atmospheric batch pressure-retarded osmosis can experience an approximately 40% efficiency reduction when under-pressurisation and entropy generation are included, according to Membranes.
The same study reported that atmospheric batch PRO remained superior to single-stage PRO at low water recoveries and maintained stable energy efficiency across different recoveries. It also found that reducing pressure losses and energy-recovery-device deficiencies could improve performance. Those gains still need to survive your feed quality and operating schedule.
Use a net-energy boundary before assigning value to any stream. Measure electricity at the system boundary after pumping, pretreatment, membrane operation, pressure exchange, cleaning, controls, and discharge requirements. MediSun Energy’s Reverse Electrodialysis and resource-recovery approach can support broader brine management, although site chemistry and integration limits may make another pathway more suitable.
Practical rule: Value PRO or RED only after you measure net output at realistic feed quality and duty cycle.
For the next screen, pair one defined brine or waste stream with one compatible counter-stream, then test the net result under representative conditions. A theoretical gradient starts the assessment. Usable output decides it.
These are not two names for the same process. Pressure-retarded osmosis, or PRO, turns water movement into pressurised hydraulic flow, while Reverse Electrodialysis, or RED, turns ion movement into electrical output. That difference determines your pumps, membranes, controls, and integration point.
Membrane-level comparisons can favour PRO, but the whole system still needs examination. A balanced model lets you compare seawater-brine pairings, industrial waste streams, and circular brine-management goals without treating one pathway as universally superior.

| situation | better move | why |
|---|---|---|
| A site has concentrated brine and a compatible lower-salinity stream, with practical access to pressurised circulation and energy-recovery equipment. | Screen PRO first. | PRO pulls water into a pressurised stream and can increase flow for turbine-pump power production, but net benefit must include hydraulic and membrane losses. |
| A site can provide two streams with a sustained salinity difference and wants direct electrical output from an electrochemical stack. | Screen RED first. | RED converts ion transport across alternating ion-exchange membranes into electrical output and may fit an electrical integration point better than a pressure-recovery loop. |
| A project team is comparing technologies using membrane power density alone. | Rebuild the comparison around net system output. | Membrane-level performance excludes pumping, pretreatment, fouling control, electrode balance of plant, and energy-recovery losses. |
| The objective includes reducing brine burden and creating an additional resource pathway, not only generating electricity. | Assess the energy pathway inside an integrated brine-management flow sheet. | The best option depends on feed quality, downstream discharge or product requirements, and whether recovery can work alongside MediSun Energy’s circular treatment and CO₂ mineralization capabilities. |
The deciding issue is where the pathway fits your pressure, electrical, pretreatment, and resource-recovery boundaries. Neither PRO nor RED wins by reputation alone.
Your recovery system starts with two compatible streams, not an isolated membrane unit. Concentrated desalination brine may meet a lower-salinity feed, while an industrial site may pair a waste stream with treated water. You then use pretreatment to protect the membrane, control fouling, and set flow conditions you can actually maintain.
You get useful output only when you count pressure, pumping, membrane contact, and downstream processing together. Your flow sheet must show where diluted draw water, electrical power, recovered pressure, discharge, or mineral products go next.

In a PRO train, you can use concentrated SWRO brine as the draw solution while a compatible lower-salinity feed moves across the membrane. Water transfer dilutes the draw, while applied pressure converts that movement into pressurised flow. You can recover part of that pressure with a turbine or pressure exchanger, although pretreatment, pumping, membrane resistance, and mechanical losses reduce the net result.
If you use an atmospheric batch design, a tank receives diluted draw solution before sending it through a pressure exchanger for recycling. A 2023 paper in Membranes described this arrangement. A 2017 Elsevier study found that a two-stage SWRO-integrated design performed better than a one-stage design without external impaired-water flows. It also found that higher feed concentration and flow improved performance, while higher second-stage recovery worsened the energy balance.
Weak configuration: “Send SWRO brine through one PRO stage and maximise recovery.”
Better configuration: “Split the brine across two PRO stages, recover pressure after draw dilution, and limit second-stage recovery when its added pumping burden exceeds its output.”
When you use RED, the salinity difference produces output in a different way. Alternating concentrated and dilute channels pass ions through selective membranes, producing electrical potential at electrode compartments. You can use the output only after accounting for membrane-pair count, ionic composition, channel flow distribution, electrode-side integration, and pumping demand.
You may route treated industrial water beside desalination brine, then send the electrode stream to suitable treatment. More membrane pairs can raise voltage, but they also increase resistance and pressure losses. Before selecting stack size, match salinity, flow, and electrode chemistry to your site conditions.
You can position Reverse Electrodialysis between brine pretreatment and resource processing, with the electrical output supporting nearby pumps or controls. Your integrated flow sheet may then direct conditioned brine toward CO₂ mineralization or other resource recovery. You still need site testing, because unsuitable ions, variable flows, or electrode management can erase the expected gain.
You can approve an attractive salinity-gradient concept and still inherit a weak energy case. The failure usually appears when a laboratory result is treated as plant output, or when a second recovery stage is added without recalculating the full flow sheet.
MIT research describes pressure-retarded osmosis as far from commercial viability and identifies draw salinity, membrane power density, and net economics as continuing constraints. Treat that finding as a screening warning, not a rejection of every PRO or RED pilot.
You cannot compare membrane power density with the electricity available at your site. For PRO, the reported result must survive concentration polarisation, pumping, pretreatment, pressure management, and conversion losses. MIT also finds that draw streams may need salinities well beyond river-water and seawater pairing for the economics to improve.
Weak claim: “The river-water and seawater pairing produces enough power for the plant.”
Strong claim: “The site produces 0 kW net after pumping, pretreatment, and pressure losses, based on measured flow and salinity data.” The zero is a placeholder for measured site data, not a forecast.
You need to test draw salinity, osmotic pressure, flow stability, and membrane compatibility together. A strong gradient can still fail if the draw stream lacks sufficient volume or creates excessive reverse salt flux. RED has different limits, because ionic composition, membrane selectivity, stack resistance, and electrode chemistry shape its output.
Your review should separate PRO’s commercial constraints from RED’s feed-quality and stack-integration trade-offs. One technology’s poor result does not validate the other automatically.
A second stage may recover more water or ions while consuming more electricity than the added product value supports. Recalculate net energy after every added pump, pressure vessel, membrane area increase, and brine-conditioning step.
What fails: “Stage two raises recovery, so the project improves.”
What works: “Stage two adds 0 kWh per cubic metre net after its pump and pretreatment loads are included.” Your engineering model must replace the placeholder with measured or defensible values.
You will not get a reliable RED comparison from stack output alone. Fouling, concentration polarisation, unsuitable ions, electrode circulation, pumping, controls, and stack integration can erase the headline result. The same checks apply before you connect RED with resource recovery or CO₂ mineralization.
You don’t need a technology verdict yet. Request measured site data and a transparent net-energy calculation, then decide whether disciplined pilot testing is justified.
You need a bounded site question before commissioning another broad study. One compatible source stream, one destination stream, and one measurable operating objective give your team something testable.
A single stream-pair page for one Singapore site turns research into a defensible basis for partnership, integration, or a decision not to proceed.
Record the source and destination streams, including flow, salinity or conductivity, temperature, contaminants, pressure, variability, cleaning requirements, and the intended discharge or product outcome.
Count pumping, pretreatment, pressure equipment, controls, electrodes, cleaning, and conversion losses. The result must show net output, not the membrane unit’s best isolated performance.
Choose pressure-retarded osmosis where pressurised hydraulic integration fits your flow sheet. Choose Reverse Electrodialysis where compatible ionic streams and electrical integration provide the better route. Test both only when the site data justifies it.
Assess whether the pathway improves brine management, reduces disposal pressure, supports energy-efficient water, or creates a resource-recovery route. MediSun Energy can discuss Reverse Electrodialysis, brine management, and CO₂ mineralization, while site data still determines suitability.
Use this sequence:
If you want a faster way to do this, MediSun Energy supports stream screening, Reverse Electrodialysis integration, and CO₂ mineralization for desalination operators, industrial manufacturers, and project partners. Explore brine-management insights and project perspectives using site data to frame feasibility discussions without promising a fixed result.